
Benchmarks#
Benchmark results are collected in the repository, one file per run, from
everyone who contributes one: benchmarks/results/<user>/<date>.json. The
charts on this page are drawn from all of them when the documentation is
built, so they grow with every contribution.
What is measured#
Two suites run on every backend the machine offers: Numba’s CPU target, numba-vulkan on every Vulkan device, and numba-cuda where CUDA is available.
Same function (benchmarks/bench.py): each workload is one scalar Python
function compiled unchanged for every backend, plus a thin per-backend
driver.
Workload |
Character |
|---|---|
|
compute-bound, data-dependent loop, little data |
|
Black-Scholes call price: |
|
memory-bound: one multiply-add per element |
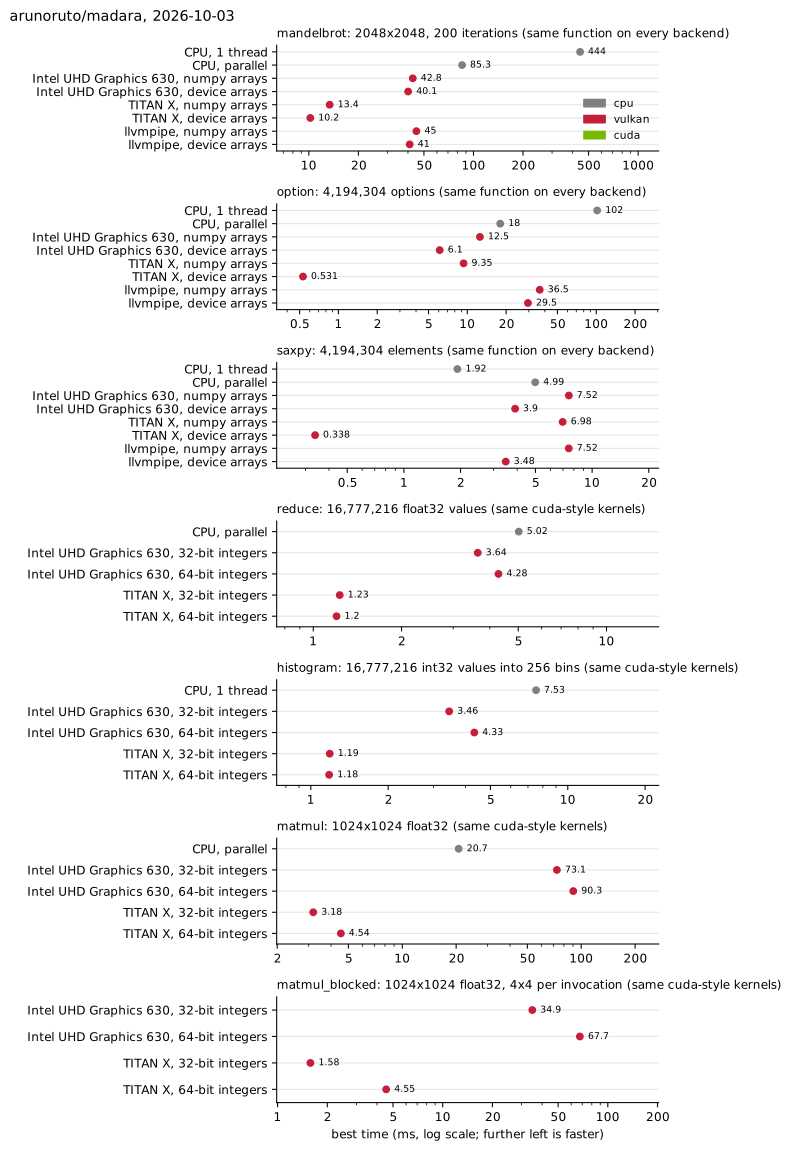
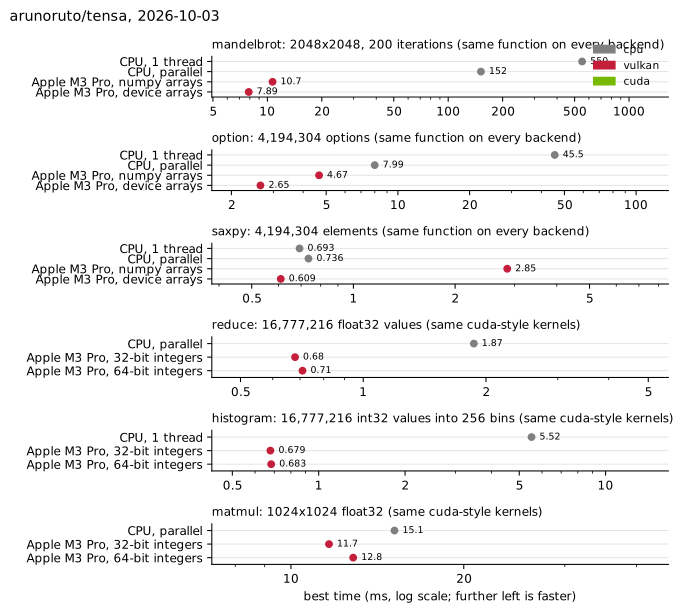
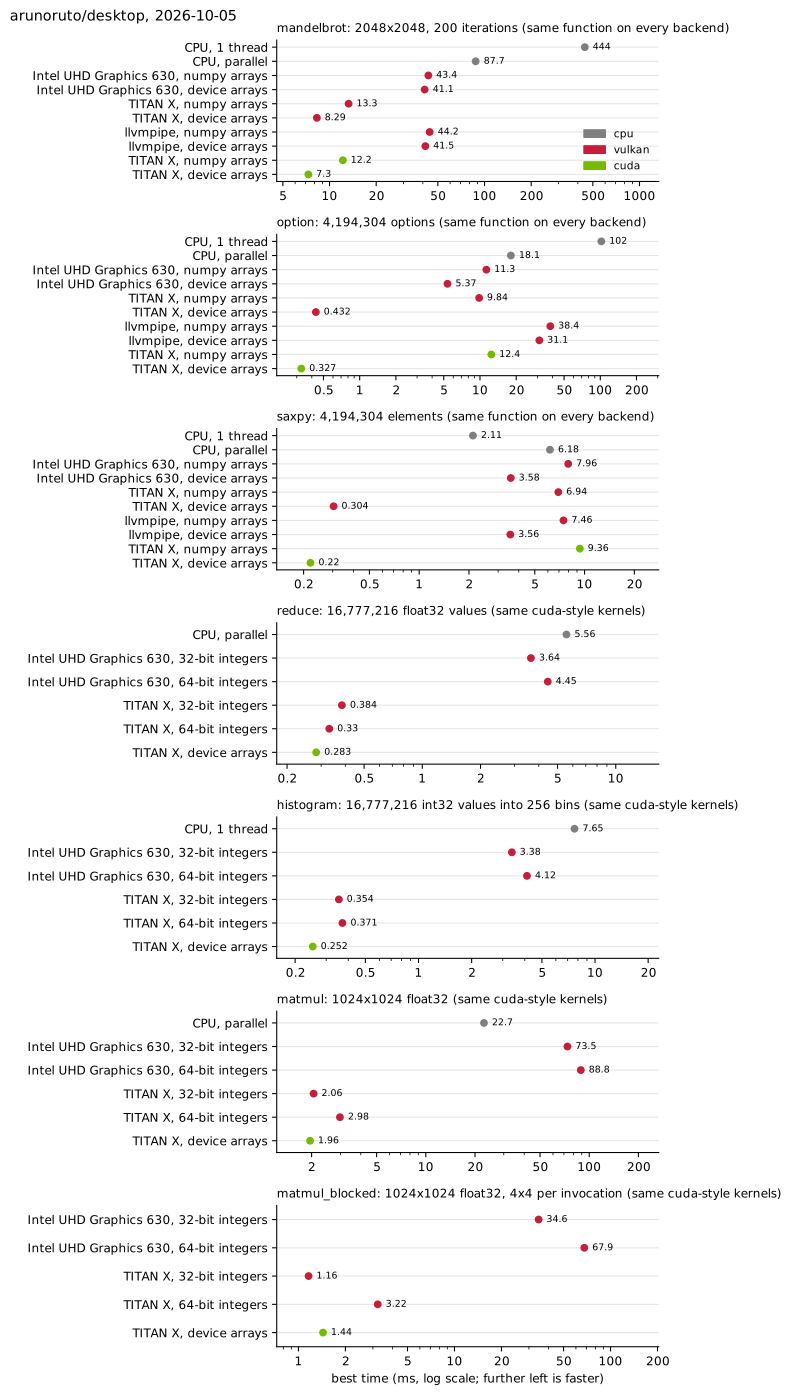
Timings are wall-clock for a complete call. Each GPU backend appears twice: with NumPy arrays as arguments (“numpy arrays”), which includes copying data to and from the device, and with device arrays, which leaves the kernel and the launch overhead.
Same kernels (benchmarks/kernels.py): CUDA-style kernels written once,
with workgroup-shared memory, barriers and atomics, and turned into a
numba-cuda and a numba-vulkan kernel by substituting the API names. The
kernels, workgroup sizes and grid sizes are identical and data stays on the
device, so these numbers compare the code generators and runtimes on equal
terms.
Workload |
Character |
|---|---|
|
sum: shared memory, barriers, one float atomic per workgroup |
|
256 bins: integer atomics in shared memory |
|
matrix product in 16×16 shared-memory tiles |
|
the same with 64×64 tiles and a 4×4 block per invocation, accumulated in registers |
On Vulkan they run twice: with 32-bit integers, the default, and with
Numba’s 64-bit integers (narrow=False).
The kernel suite measures every call three ways: until the launch returns
(the cost of launching from Python), until the device has finished (end to
end), and between two events recorded before and after it (device_s,
the time the device spent; nv.event on Vulkan, cuda.event on CUDA).
For a small kernel the difference is the launch overhead: summing 4 M
floats took 0.07 ms on a TITAN X’s clock and 0.28 ms end to end. The
backends take turns, round by round, so that changes in clock speed or
temperature during a run affect all of them alike.
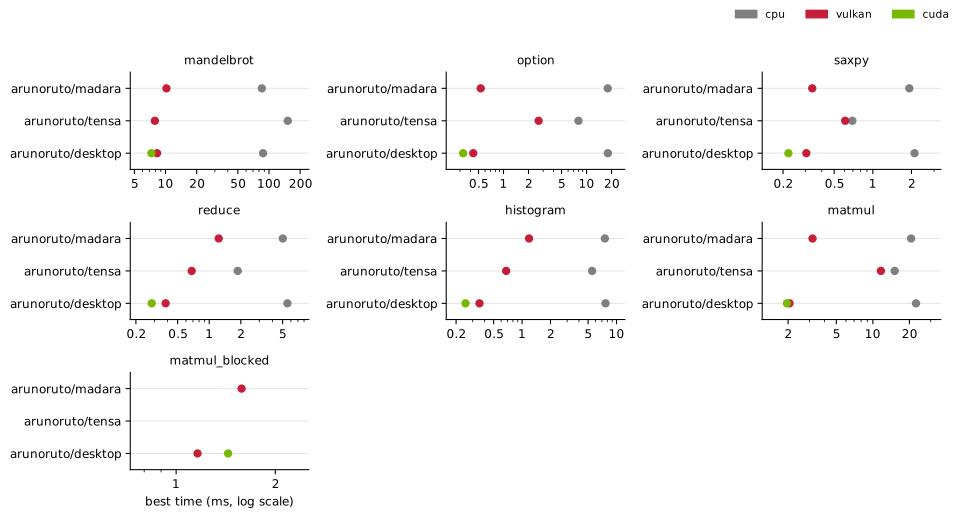
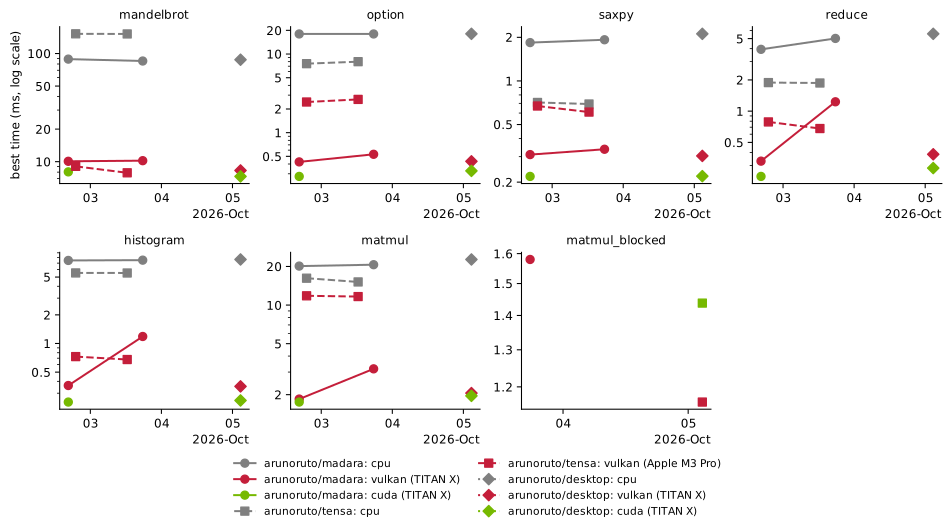
Every result keeps all timed calls; the charts show the best end-to-end time.
benchmarks/streams.py compares processing data in chunks one after
another with three streams that overlap copies and kernels (see
Usage). Its results are printed, not collected.
Results#
Machines compared#
The latest run of every machine, fastest result of each backend.
Over time#
Best time per workload, run by run.
arunoruto/madara#
Latest run, 2026-10-03: every backend, device and variant.
arunoruto/tensa#
Latest run, 2026-10-03: every backend, device and variant.
arunoruto/desktop#
Latest run, 2026-10-05: every backend, device and variant.
Runs#
Who / machine |
Date |
Commit |
CPU |
GPUs (Vulkan) |
|---|---|---|---|---|
arunoruto/desktop |
2026-10-05 |
75e339e |
Intel® Core™ i9-9900K CPU @ 3.60GHz |
NVIDIA TITAN X (Pascal) (580.173.02), Intel® UHD Graphics 630 (CFL GT2) (Mesa 26.1.8) |
arunoruto/madara |
2026-10-03 |
0c74448 (modified) |
Intel® Core™ i9-9900K CPU @ 3.60GHz |
NVIDIA TITAN X (Pascal) (580.173.02), Intel® UHD Graphics 630 (CFL GT2) (Mesa 26.1.8) |
arunoruto/tensa |
2026-10-03 |
18a18fb |
Apple M3 Pro |
Apple M3 Pro (1.4.2) |
arunoruto/tensa |
2026-10-02 |
d361eac |
Apple M3 Pro |
Apple M3 Pro (1.4.2) |
arunoruto/madara |
2026-10-02 |
fa6edce |
Intel® Core™ i9-9900K CPU @ 3.60GHz |
NVIDIA TITAN X (Pascal) (580.173.02), Intel® UHD Graphics 630 (CFL GT2) (Mesa 26.1.8) |
Contributing results#
uv sync --group bench        # adds numba-cuda; optional
uv run python benchmarks/collect.py --user <your GitHub name>
This runs both suites (a few minutes) and writes
benchmarks/results/<user>/<date>.json. Commit that file in a pull request.
The scripts are part of the repository, not of the package on PyPI; the zip
of main from GitHub works as well as a git clone, and the result then
records no commit. The machine is labelled with its host name; --machine
chooses another label, which also keeps apart runs of one machine in
different conditions, such as a laptop in power-saving mode. --quick runs small problem sizes for trying it out; such runs are
not charted. NUMBA_VULKAN_BENCH_USER and NUMBA_VULKAN_BENCH_MACHINE can
stand in for the options. On a machine without CUDA, such as a Mac, the
CUDA rows are left out; uv sync --group bench is not needed there.
The file holds the handle and the machine label, the
date, the commit, the versions of Python, Numba, llvmlite, NumPy, numba-cuda
and libclc, the operating system, the CPU model and memory size, every
Vulkan device with its driver and the workarounds numba-vulkan applies to
it, and the CUDA device. Nothing else about the machine or its user is
recorded. benchmarks/collect.py
describes the format; tests/test_benchmark_results.py checks every file
against it.
To draw the charts without building the documentation:
uv run --group docs python benchmarks/report.py /tmp/charts
Both scripts also run on their own and print their results:
uv run python benchmarks/bench.py --size 1024 --repeat 3
uv run python benchmarks/kernels.py --all-devices